
This section covers the Imagemapping part of the Malta 1995 Census Project. A series of maps have been created for interactive use. The maps are divided into 10 categories as indicated in the titlebar above, each with links to specific maps. Each of these sections depicts interactive map examples. These maps, as well as a large number of other maps, can be generated by users depending on attribute choice by utilising the CensArc section of this site.
This page gives an overview of the following:
The section below depicts 3 Summary tables for the different Spatial Data Aggregations available as Imagemaps. To access data relevant to each of the Census categories click on the relevant section in the titlebar above (listed in full in the table below).
Categories
Category Code
Category Name
The sections activate specific category pages, each depicting a number of maps, either in chorpleth or graduated symbol format. Other formats (topographic, 3D) are also included. For a full list of maps and tables click on the following links:

Spatial Data Aggregations
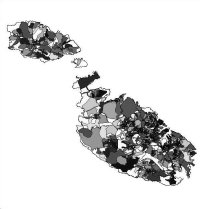
Enumeration Areas (EAs) - Geographic areas representing 150-180 households each. Not analysed in this study. However 2 maps have been published for user familiarisation. One map depicts all the Maltese Islands EAS (843) whilst the second map represents a more detailed description of Valletta and Floriana EAs.

Local Councils - Smallest level analysed in this study (67 Councils at time of Census 1995 - 53 in Malta and 14 in Gozo & Comino). These are administrative areas with executive power over specific services and functions. Aggregations of these councils for higher level districts such as the Education, Police, Electoral and Health Districts which fall under central governance.
Census Regions - Higher level aggregates designated by the Central Office of Statistics (6 Regions) soley for Census purposes.
Local Plan Areas - Higher level aggregates designated by the Planning Authority (7 Areas) for planning purposes. Some Local Plans cross Local Council boundaries.
The map icons used in this Census are listed below. Each icon is indicative of map type and serve as hotlinks to the specific category map.
Local Councils
Census Regions
Local Plan Areas
A general map with unique data extracted from the different datset sections have been gathered in the following map. There are 3 maps based on 3 different data aggregation levels and the corresponding data tables:
Map Name |
Map Description |
Local Council |
Census Regions |
Local Plan Areas |
| Summary | Map depicting unique data for each Area taken from the different tables in the study |
|
|
|
Table Name |
Table Description |
Local Council |
Census Regions |
Local Plan Areas |
| Summary | Table depicting unique data for each Area taken from the different tables in the study |
|
|
|
The categories representing the attribute lists are abbreviated (in the maps) and the full attribute names are listed below. Each of the maps in subsequent caregories shall be accompanied by a similar table as necessary.
Map Abbrv. |
Attribute Name |
| EnumPop | Enumerated Population |
| MaltPop | Maltese Population |
| Nmalpop | Non-Maltese Population |
| Density | Population Density (pers/sq. km) |
| PrivPop | Population Living in Private Households |
| InstPop | Population Living in Institutions |
| Houshold | Private Households |
| OccuDwl | Occupied Dwellings |
| RentDwl | Rented Dwellings |
| SharDwl | Shared Dwellings |
| VacnDwl | Vacant Dwellings |
| SummDwl | Summer Dwellings |
| WorkPop | Economically Active Population |
| Unemply | Unemployed Persons |
| Illiterate | Illiterate Persons |
![]()
Home, MSc Project, Imagemapping Section, Census ArcExplorer Section, Population Pyramids, Links
Saviour Formosa Email: sformosa@europe.com