Sample file used for this guide: PopDens (Population Density)
- Load ArcExplorer
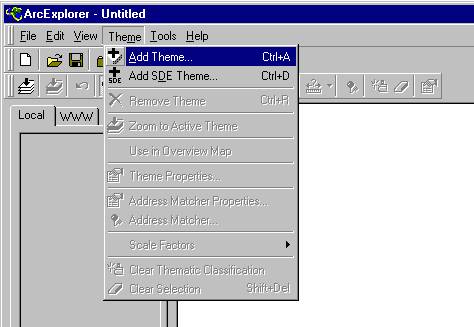
- Theme Menu
- Add Theme
- Local Window
- Theme Section
- Theme Properties
- Classification Options
- Class Breaks
- Legend
- MapTips
- Query Tools
- Customising Options
- Info Tool
- Zooming and Panning Tool
- Find Tool
- ArcExplorer Projects
![]()
![]()
![]()
2) Click on Theme Menu and then on to Add Theme button or CTrl+A
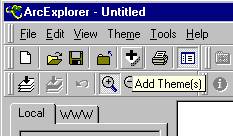
or click on Add Theme button
![]()
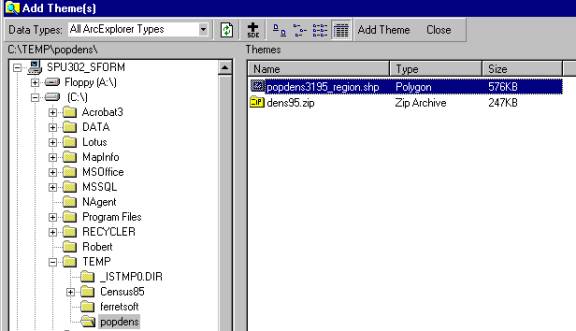
![]()
3) Find data file to load in the Add Theme window that pops up. Click on the *.shp file in the themes windows. This will automatically load the file in the ArcExplorer window. Close the Add Theme window.
![]()
![]()
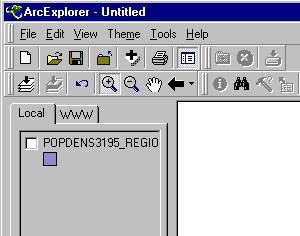
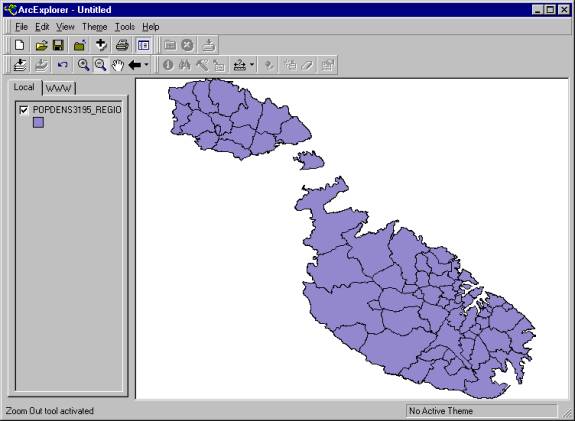
4) Click on white box in the Local window next to the dataset name
![]()
![]()
![]()
![]()
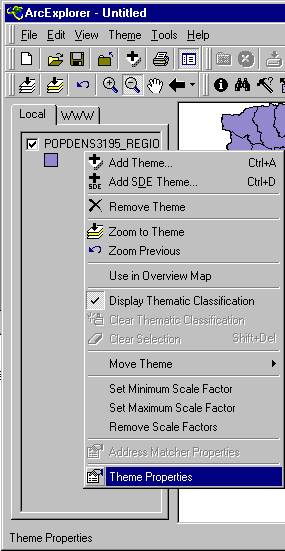
6) To change the settings: Right click on the file name in the left window and choose theme properties
![]()
![]()
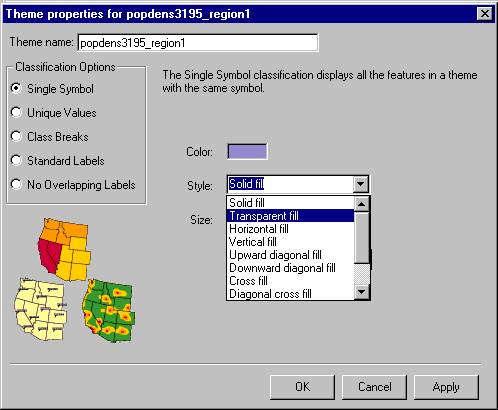
7) The properties window allows you to change the Classification Options:
a) Single Symbol allows change in colour, style (fill type) and Size
b) Unique Values gives a map as per required field
c) Class Breaks is ideal for map generation based on ranges
d) Standard Labels - self explanatory
e) No overlapping labels - self explanatory
![]()
![]()
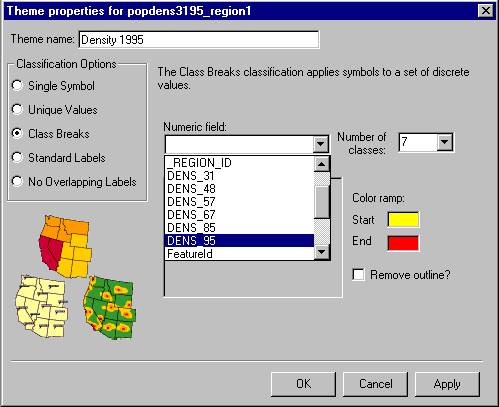
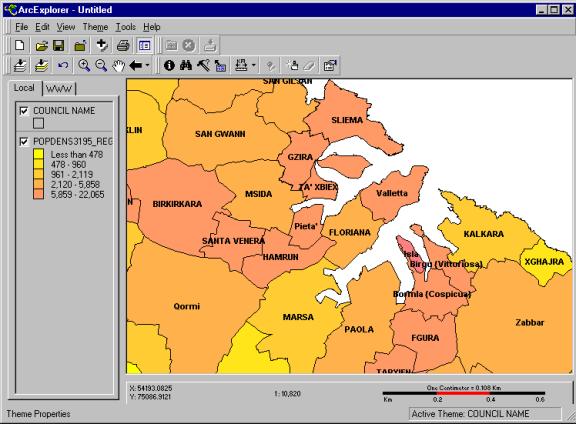
8) In this example we shall generate a Population Density Map Based on Class Breaks
a) Click on Class Breaks
b) Choose Number of Classes (preferred ranges). 7 were chosen in this case
c) Choose the preferred colour range from the Color Ramp section
d) Choose the Attribute file from the Numeric Field list button (in this case DENS_95
e) Click OK
![]()
![]()
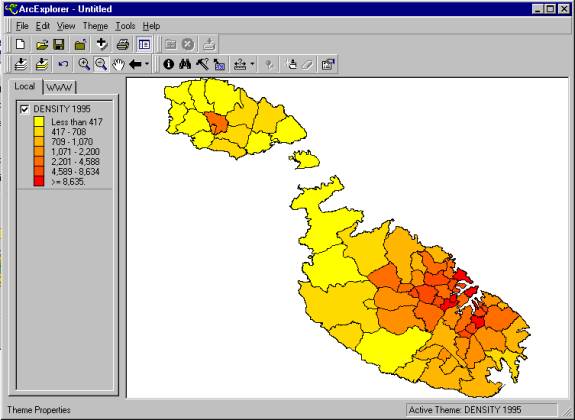
9) The output is automatically generated in the Theme window with the legend generated under the Local section
![]()
![]()
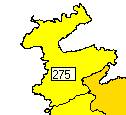
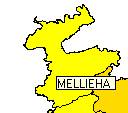
a) Mouse-over data visuals. To exhibit data once the mouse moves on a particular council, click on the MapTips icon

b) Choose the attribute from the MapTip Field Selection window and click OK
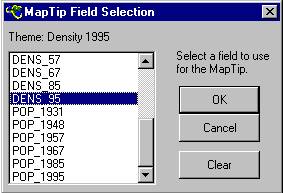
c) Move mouse over a council and the a tip with the data pops up (in this case it gives the population density of Mellieha which stood at 275 persons/km2 in 1995.
d) Alternatively on can choose Location to bring up council names, etc.
![]()
![]()
11) Further options: Query Tools
a) To query the data, click on the Query Builder icon

b) Select a field to query and choose the operators as needed (=,>,and, etc.) The results can be saved as text files (Ascii format)
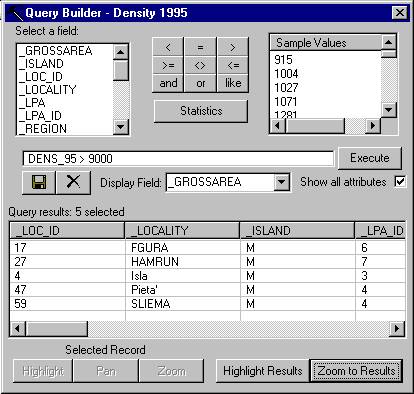
c) The graphic results can also be saved as *.bmp or *.emf either as a complete map with the highlighted option clicked or else one can click on the Zoom to Results button, to zoom in and save the chosen (highlighted) areas. Images can be saved by clicking on the Edit tab in the Menu toolbar.
![]()
![]()
12) Further options: Customising Options
a) To add a scale bar, click on the View tab in the Menu toolbar, then choose Scale Bar Properties and Scale Units
b) Clicking on the Display Scale Bar tab, displays the bar at the bottom (right hand side) of the screen
![]()
![]()
![]()
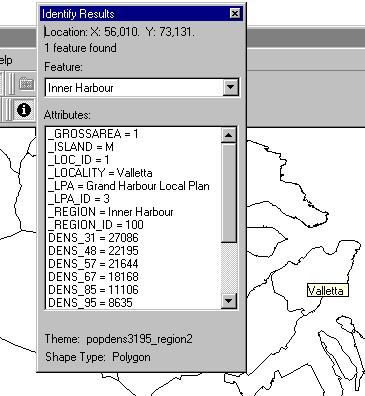
13) Further options: Info Tool
a) Click on the Identify icon

b) Clicking on a particular councils activates an Identify Results window which lists all the attributes in the dataset
![]()
![]()
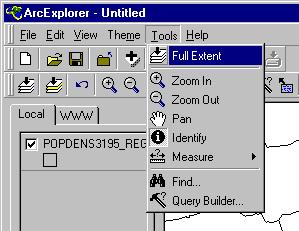
14) Further options: Zooming and Panning Tool
Click on the Tools Menu and choose the preferred option (zoom in, zoom out, pan)
![]()
![]()
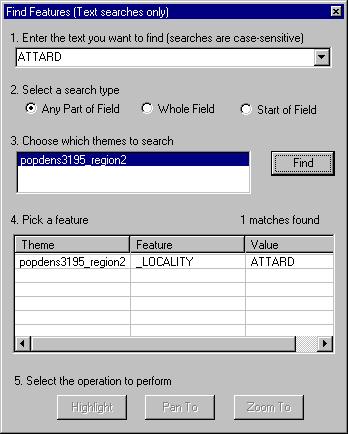
15) Further options: Find Tool
a) Click on the Find icon to activate the Find Feature Window

b) Enter the text in the textbox marked 1, choose theme to search and click on Find. The results can be highlighted, panned and zoomed to
![]()
![]()
16) Using ArcExplorer Projects (*.aep)
a) Click on the Open Project tab under the File tab in the Menu toolbar
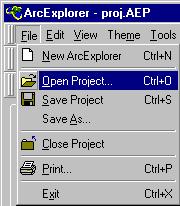
b) A number of maps can be loaded and saved as a project for layer analysis.
![]()