The most important demographic characteristic of a population is its age-gender structure. Age-gender pyramids (also known as population pyramids) graphically display this information to improve understanding and ease comparison. Age-gender pyramids display the percentage or actual amount of a population broken down by gender and age. The five-year age increments on the y-axis allow the pyramid to vividly reflect long term trends in the birth and death rates but also reflect shorter term baby-booms, wars, and epidemics.
![]()
Pyramid Types
There are three key types of population pyramids:
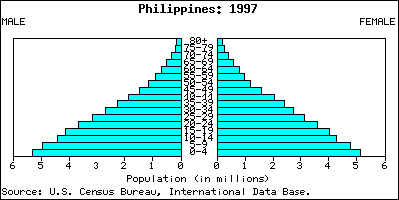
Rapid Growth
This pyramid of the Philippines shows a triangle-shaped pyramid and reflects a high growth rate of about 2.1 percent annually.
Slow Growth
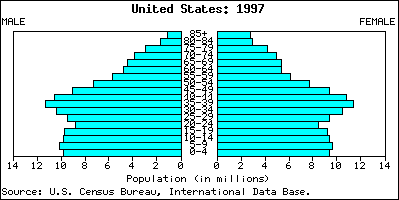
In the United States, the population is growing at a rate of about 1.7 percent annually. This growth rate is reflected in the more square-like structure of the pyramid. Note the lump in the pyramid between the ages of about 35 to 50. This large segment of the population is the post-World War II "baby boom." As this population ages and climbs up the pyramid, there will be a much greater demand for medical and other geriatric services. An animated population pyramid from 1950 to 2050 shows the aging of the boomers.
Negative Growth
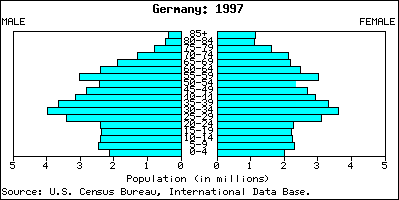
Germany is experiencing a period of negative growth (-0.1%). As negative growth in a country continues, the population is reduced. A population can shrink due to a low birth rate and a stable death rate. Increased emigration may also be a contributor to a declining population.
![]()
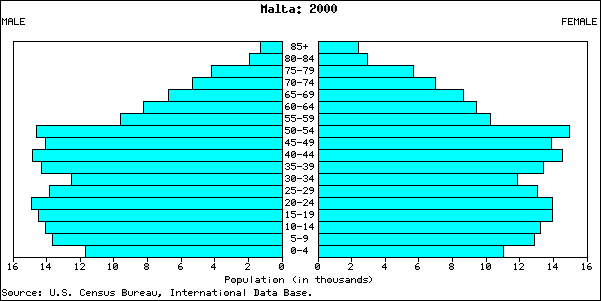
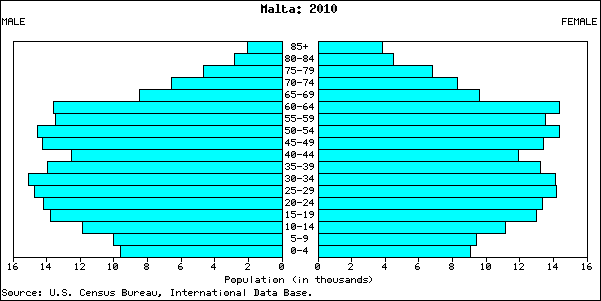
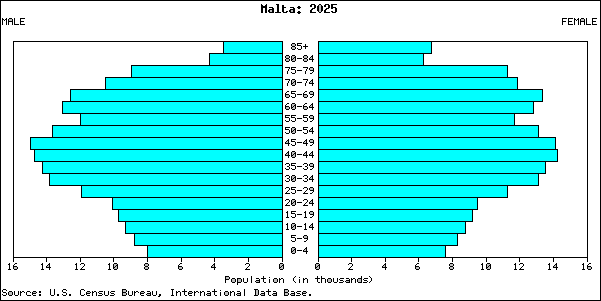
The Maltese Scenario
The population pyramids for the Maltese Islands indicate a rapidly ageing population structure, which accelerates between 2025 and 2050. Each of these pyramids points at the transitional phases that each cohort will go through: the rapid decline in births, a corresponding decline in children of school age, a decline in the working-age population and a rapid increase in the older age groups, especially the female old-old group (75+ years).
